Tableau is a popular visualization tool for business intelligence, and Nexla makes it easy to connect your data from anywhere to Tableau in minutes. In this tutorial, we’ll be showing a step-by-step process for how to do this in Nexla from any source. This process usually takes data engineers hours of time, but with Nexla’s automatic processes anyone can do it in minutes. In addition, the flow you set up will automatically update with new data and scale to any amount of data you input. This setup makes your Tableau visualization more powerful and accessible, as well as connected to real time data.
1. Create a New Flow
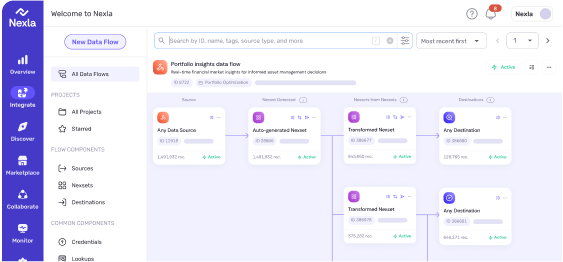
Navigate to Flows on the left toolbar, then Create a New Flow. Click Create and you’ll be directed to connect your data source and credentials.
2. Add your Source Data
Select your data connector from Nexla’s extensive list. New connectors can be added upon request by contacting help@nexla.com. Input your credentials and make sure your data is previewing how you expect it to. Then, click the blue Create button to create your source. Nexla will automatically detect and format your data into a dataset, which should appear in seconds.
3. Transform and Select Data
After your dataset appears, click the blue Transform button to create your final dataset. Select the data and transformations you may like to apply, and once the dataset looks correct on the right click Next.
4. Add your Tableau Credentials
Now, click Write your Dataset to Destination on the right, and select Tableau as your destination. Input your tableau login credentials, as well as your project name and server. At the bottom, add your project folder name as well as what you’d like this data to be named as a Hyper file. Check one last time that the entries on the right look correct, then click the blue Create button.
5. Complete Flow
Your flow of data will start automatically and you can see each step in your Data Flows. Your data should automatically appear in Tableau where you directed it in the last step.
6. Create Tableau Workbook and Visualize
Now, take your complete Hyper file and connect that data to your workbook of choice for visualization. This data will update automatically with any updates to the root source, and can scale in Nexla automatically to meet your growing needs. That’s it!
This is one example of Nexla’s powerful one-click data flow setup that makes it easy for anyone to send data to Tableau from any source, without a data science degree. To learn more or request a free trial, visit our website at www.nexla.com.
MCP Security That Uses Your Identity, Your Credentials, and Your Policies
As AI agents reach into enterprise systems, the question is not whether they can connect, but whether they do it without bypassing your security controls. Here is how Nexla keeps MCP access tied to each user’s identity and credentials, and lets your systems keep enforcing their own policies.
MCP Tool Bench is a controlled way to benchmark MCP server design. We put Nexla’s task-specific MCP servers against off-the-shelf ones on real BigQuery tasks, in two harnesses, and measured the agent effort each demanded.